
How to Measure ROI for Automotive Portals: Lessons from Ligier Store Doesburg
During last week’s #DCDW event, I gave a presentation on how we at Ligier Store Doesburg - Experience Center calculate the ROI of automotive portals. While I used Marktplaats as an example, the same approach applies to other platforms as well.
The underlying idea behind evaluating ROI is that, from a marketing perspective, I need to determine whether my investments are delivering the expected returns. For example, if I receive 50 leads from Platform Y, but my sales team doesn’t follow up by calling, emailing, or messaging them, resulting in few sales, is that a poor marketing investment? Or is the sales process the problem?
The ROI Mindset
When evaluating ROI, I approach it from a marketing perspective: are my investments delivering the expected returns? Let’s say I get 50 leads from Platform Y, but my sales team doesn’t follow up by calling, emailing, or messaging them. As a result, few leads convert to sales. Is that a poor marketing investment, or is the sales process the problem?
As the marketing department, my job is to create opportunities, while the sales team is responsible for converting at least 13% of those opportunities. Both departments have distinct responsibilities. A "bad" lead is more likely to convert with a solid sales process than a "good" lead with a poor process.
Practical Example
In October 2024, we invested €705 in Marktplaats and achieved the following results:
21,490 VDP views (Vehicle Detail Page views)
257 URL clicks
58 leads (50 via Direct Messaging, 8 via phone calls)
5 cars sold
How do you calculate ROI for this?
If you look at the Cost per Sale (CPS), it came out to €141 per car sold that month. However, the previous month, we sold only one car through Marktplaats, making the CPS €705. This fluctuation makes CPS less reliable for marketing decisions. Instead, I prefer evaluating performance over a longer period, focusing on how marketing investments create opportunities.
The Role of the VDP View
For me, the VDP view is the most critical metric. Without VDP views, there are no leads, calls, or dealership visits. With Google rolling out Vehicle Listing Ads (VLA) and our participation in the pilot, the Cost per VDP is becoming increasingly relevant.
We’ve seen similar principles with platforms like GasPedaal.nl, but Google adds a new dimension to it. Currently, the CPC (Cost per Click) in the pilot is around €3. So, if the Cost per VDP becomes key, how do you calculate ROI?
A New Approach to ROI Calculation
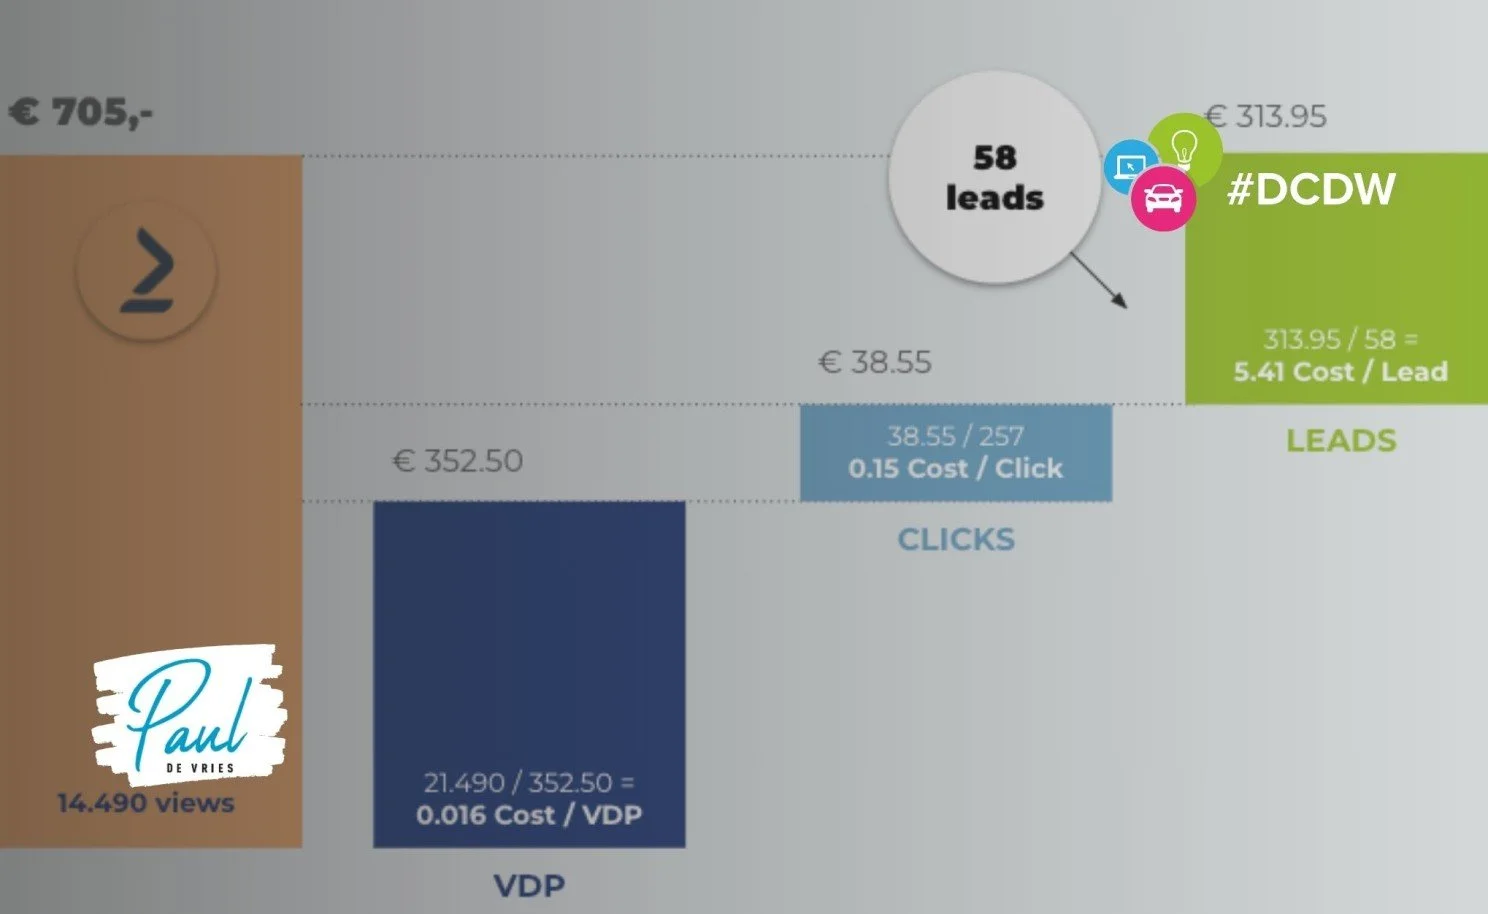
I propose allocating 50% of the marketing investment to VDP views. Here’s how it breaks down:
VDP Cost:
50% of €705 = €352.50
Cost per VDP = €352.50 ÷ 21,490 VDP views = €0.016 per VDP view
URL Click Value:
€0.15 per click × 257 clicks = €38.55
Cost per Lead:
Remaining budget: €705 - €352.50 - €38.55 = €313.95
Cost per Lead = €313.95 ÷ 58 leads = €5.41 per lead
Conclusion
This method can vary by dealership and month, but it provides marketers with a useful framework to evaluate the value of a portal. If you only look at Cost per Sale, your decisions rely too heavily on the sales process. This can shift the focus to chasing "better leads" rather than improving the sales process.
The reality is, there are no "better leads"—only better processes. A strong sales process will always generate more revenue than relying solely on higher-quality leads. With this approach, you can better evaluate and optimize both your marketing investments and sales process. That way, you’ll know whether your marketing dollars are truly delivering results.